Apart from triggering relays (opening automated gates, turnig off lights etc), GDO PI can also continuously read data from sensors such as temperature, air quality, humidity, ultra sensors etc. In this article I am going to show you how to connect your GDO PI account with Grafana.
Through GDO PI, a Raspberry PI can work with up to 4 sensors. These sensors can be defined during the setup process on the Raspberry PI. The setup process will also create a RAM disk in /mnt/gdopi_rd. In this folder, depending on how many sensors you configured during the setup process, GDO PI will read sensor1.txt, sensor2.txt, sensor3.txt and sensor4.txt. The strings from these files will be uploaded onto the database. So basically what you have to do is make your python script write the sensor value in these text files. So for example if you have just one sensor you will write the value in sensor1.txt.
How to view the sensor information & history. Create an account with https://grafana.com/ . Then go to Configuration – Data Sources and choose JSON as data source. In the URL field input this:
https://gdo-backend.herokuapp.com/sensorhistory?email=<your GDO PI account email>&pass=<your password>
In Auth section turn everything off apart from Skip TLS Verify (this needs to be on). Then press Save & Test.
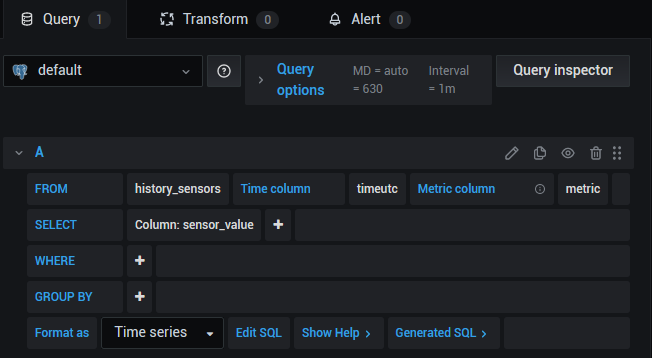
Now we can go ahead and create a new dashboard. In the new dashboard create a new panel. Scroll down and choose the values as shown in the screenshot:
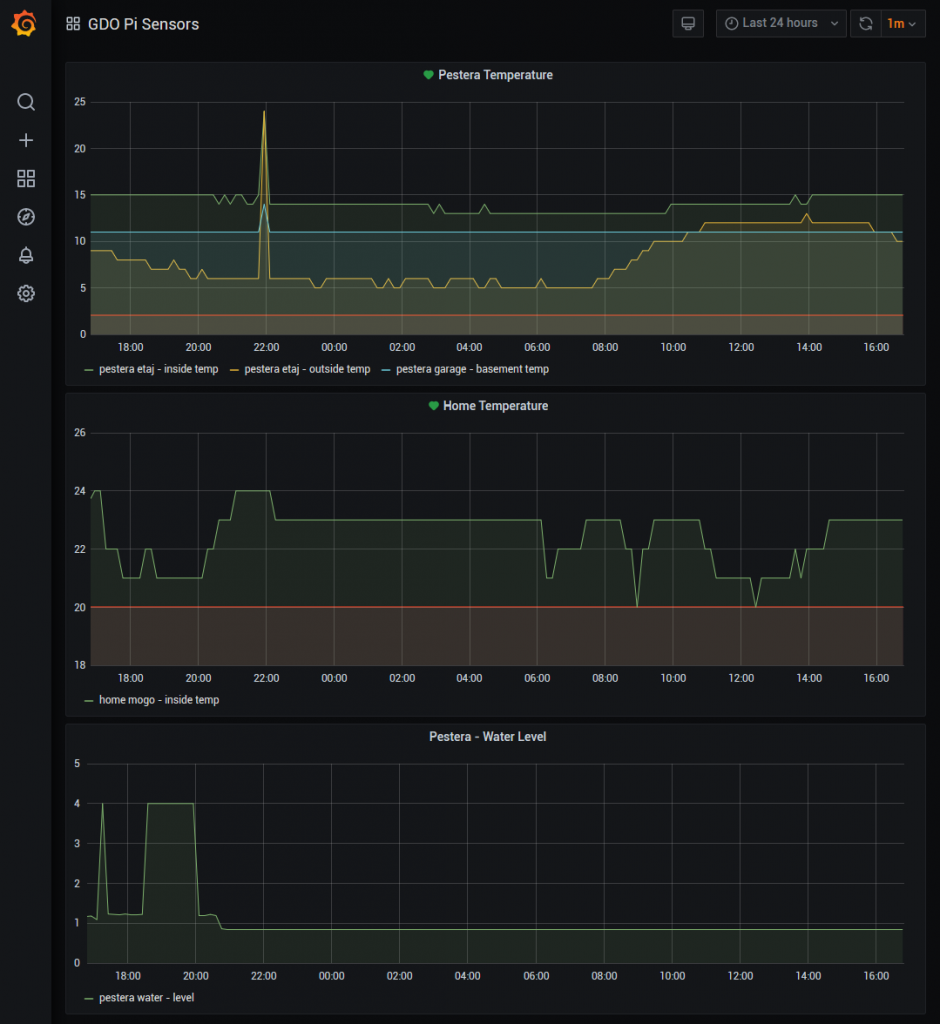
Now that sensor information is fed into Grafana you can also add alarms – for example if temperature drops below 2 degrees have Grafana send you an email.
That’s it. Enjoy!
One Reply on “Adding graphs to GDO PI sensors”